“What algorithmic risk assessment has done is reveal the inequality inherent in all prediction, forcing us to confront a much larger problem than the challenges of a new technology. Algorithms shed new light on an old problem.”1

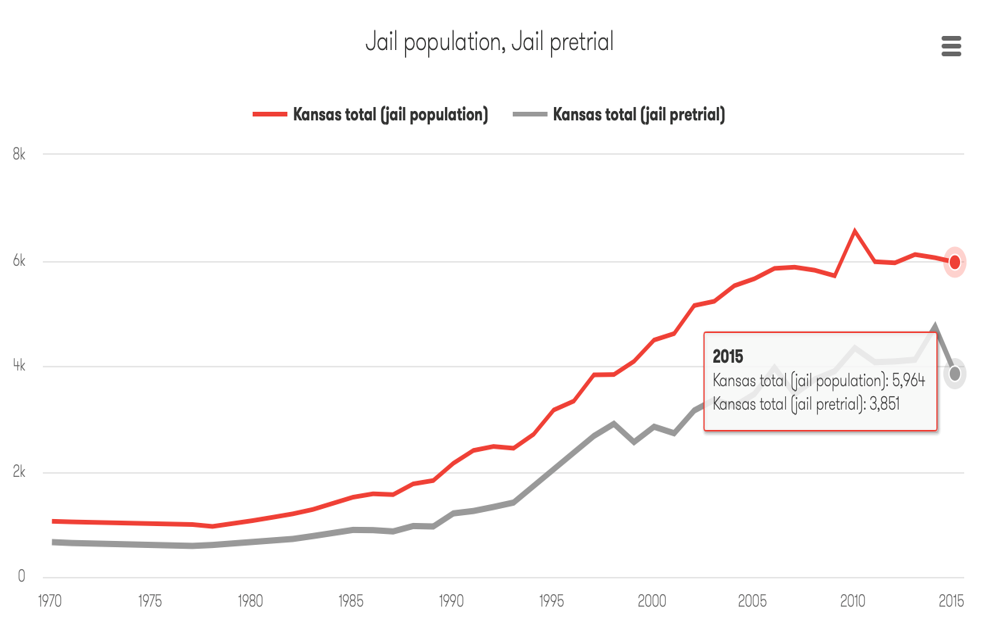
The use of Risk Assessment Instruments (RAI) has become more popular as people in power try to find ways to decrease jail time, while still hoping to claim they are “tough on crime.” RAIs are purported to evaluate whether an individual should be released on bail or detained prior to trial. However, while these instruments are typically defended as streamlining the process for making pretrial decisions, they pose threats to civil liberties and may NOT result in the reduction of the prison population.

A government agency, such as a District Attorney’s office, can use risk assessment tools as a means to determine who gets bail and how much, who gets released pre-trial because they are deemed not to be a risk. However these assessment tools perpetuate the systems of white supremacy that has infected all facets of the criminal legal systems, such as policing, prosecutors, and courts. Risk Assessment Instruments in the pre-trial decision making process will never be able to fully account for the built-in biases that are inherent in this type of data. It’s as simple as racist data in, racist data out.

It’s not just the criminal legal system data that feeds the algorithms. RAI’s are increasingly using data about a person’s employment, education level, housing, healthcare, income, and community relationships to help make pre-trial decisions. In other words, a person’s life, liberty, and pursuit of happiness can be at the mercy of risk assessment tools that attempt to predict the future based on data that has built-in institutional racism and bias. 

The jail population has been rising in Kansas for the last thirty years. In 2015, the jail population was 5,964 people. Of those 5,964 people in jail, almost two-thirds of them were there pre-trial. In other words, nearly 2/3 of people in Kansas’s jails have not yet been convicted of a crime and are presumed innocent. Criminal Justice reform, and pre-trial reform in particular, must address the rising jail population. There are proven policies that can achieve this goal that don’t require the use of racist Risk Assessment Instruments.
 
 
Vera Institute of Justice, “Incarceration Trends” Website
From the Vera Institute of Justice, “Incarceration Trends” Website
 
Vera Institute of Justice, “Incarceration Trends” Website
From the Vera Institute of Justice, “Incarceration Trends” Website
 

The Problem

Algorithms shed light on racial biases and discrimination in the criminal legal system that stems from the historical context of white supremacy, slavery, convict leasing, Jim Crow Laws, Redlining, the War on Drugs, Mass Incarceration, and the ongoing economic exploitation, and over policing and prosecution of Black and Brown people. 
 
“That order of operations can be problematic given the range of data that fuels the forecast. Data scientists often refer to this type of problem as “garbage in, garbage out.” In a historically biased criminal justice system, the “garbage in” can have grave consequences.”2
 
Risk Assessment tools are not the solution to alleviating overcrowding and racial disparities in Kansas’s criminal legal system. 
The data that feeds the algorithms used in the Risk Assessment Instruments are often proxies for racial discrimination. One study found that 16 counties in Kansas were currently using risk assessments, but it is unclear exactly what criteria they are using because this information is not made to the public in an accessible way. The lack of transparency around the auditing process, how the risk assessment tools are used, and what data goes into the algorithm do not allow for the adequate protection of a person’s civil rights and liberties under the Constitution. 
 
“Any system that relies on criminal justice data must contend with the vestiges of slavery, de jure and de facto segregation, racial discrimination, biased policing, and explicit and implicit bias, which are part and parcel of the criminal justice system. Otherwise, these automated tools will simply exacerbate, reproduce, and calcify the biases they are meant to correct.”3
 
Research on risk assessment instruments in use around the country found that they often consisted of some or most of this criteria:
 
  • Defendant age 
  • Substance use
  • Criminal history, including violence and failure to appear 
  • Active community supervision
  • Pending/current charge(s) 
  • Employment stability 
  • Education 
  • Housing/residential stability
  • Family/peer relationships 
  • Community ties
Why is it so problematic that risk assessment instruments are currently being used in Kansas and may be further implemented in more counties? Because the data in Kansas shows that racial biases, discrimination, and the power structures that allow for systems of white supremacy and oppression to have yet to be adequately addressed. A risk assessment tool developed with biased data will produce biased outcomes. 
 
Examples of Institutional Racism and sources of biased data that may potentially be used in Risk Assessment Instruments include:
  • Policing – traffic stops and searches, arrests, stop and frisk, broken windows policing, the drug war
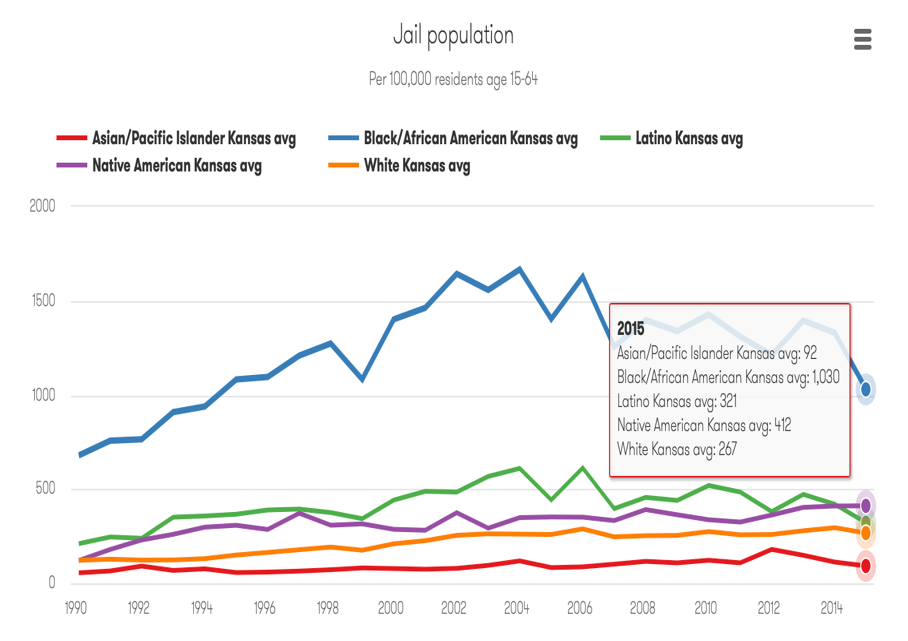
  • Jails and Prisons – In Kansas, Black people are about four times more likely to be incarcerated
  • Prosecutors – discretion in bail, plea bargaining, what charges to bring, probation, juries and jury selection 
  • Courts – racial disparities in sentencing
  • Healthcare -  lack of access, insurance, mental health care, neo-natal care, 
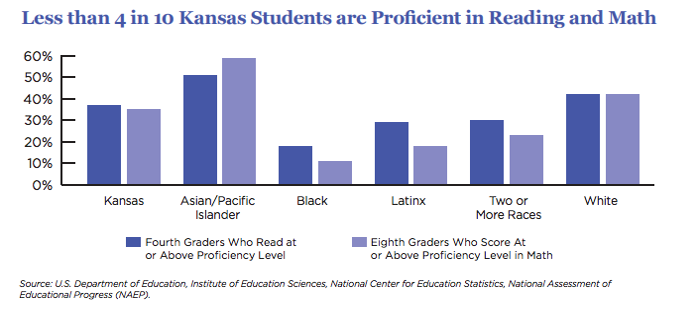
  • Education – school discipline and suspensions and the school-to-prison pipeline 
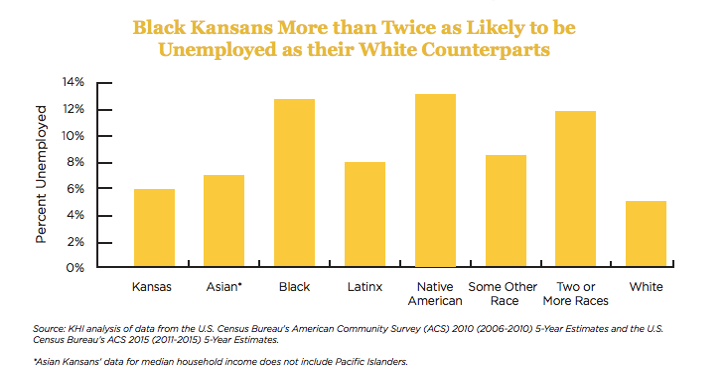
  • Employment – disparities in unemployment rates, discrimination in hiring practices

Healthcare, Education, Employment, and Housing Data in Kansas

Black students are 5 times as likely to be suspended as White students.4 
 
ks students reading math
 
One-quarter of Black (25.4 percent) and Latinx (25.3 percent) Kansans live in poverty, compared with white Kansans (10.6 percent). For children in Kansas, the percentage of children of color living in poverty is even more pronounced. Compared with white children in Kansas (10 percent), Black children are four times as likely (40 percent) and Latinx children are twice as likely (22 percent) to live in poverty.5
 
unemployment in KS
 
 
The use of Risk Assessment Instruments are a recipe for disaster and will not get to the root of the problem – that the vestiges of slavery and white supremacy are still pervasive in the criminal legal system. Half measures and tepid reforms that do not tackle the problem head on will not get us any closer to dismantling white supremacy and other forms of oppression. 


1 Mayson, Sandra Gabriel, Bias In, Bias Out (September 28, 2018). 128 Yale Law Journal __ (2019 Forthcoming); University of Georgia School of Law Legal Studies Research Paper No. 2018-35. Available at SSRN: https://ssrn.com/abstract=3257004
2 Vincent Southerland - Executive Director, Center on Race, Inequality, and the Law, NYU Law.
3 Vincent Southerland - Executive Director, Center on Race, Inequality, and the Law, NYU Law.
5 2018 Kansas Health & Prosperity Index (HAPI)Tackling the Legacies of Unfairness Facing Kansans of Color: Enhancing Opportunity for Every Kansan https://realprosperityks.com/wp-content/uploads/2018/12/2018_HAPI_report...